Your days, nights and weeks, in context
Today shows how your day is going compared with your own other days. Insights looks across weeks to show how often episodes happen, how high they go and how quickly you recover.

What it does
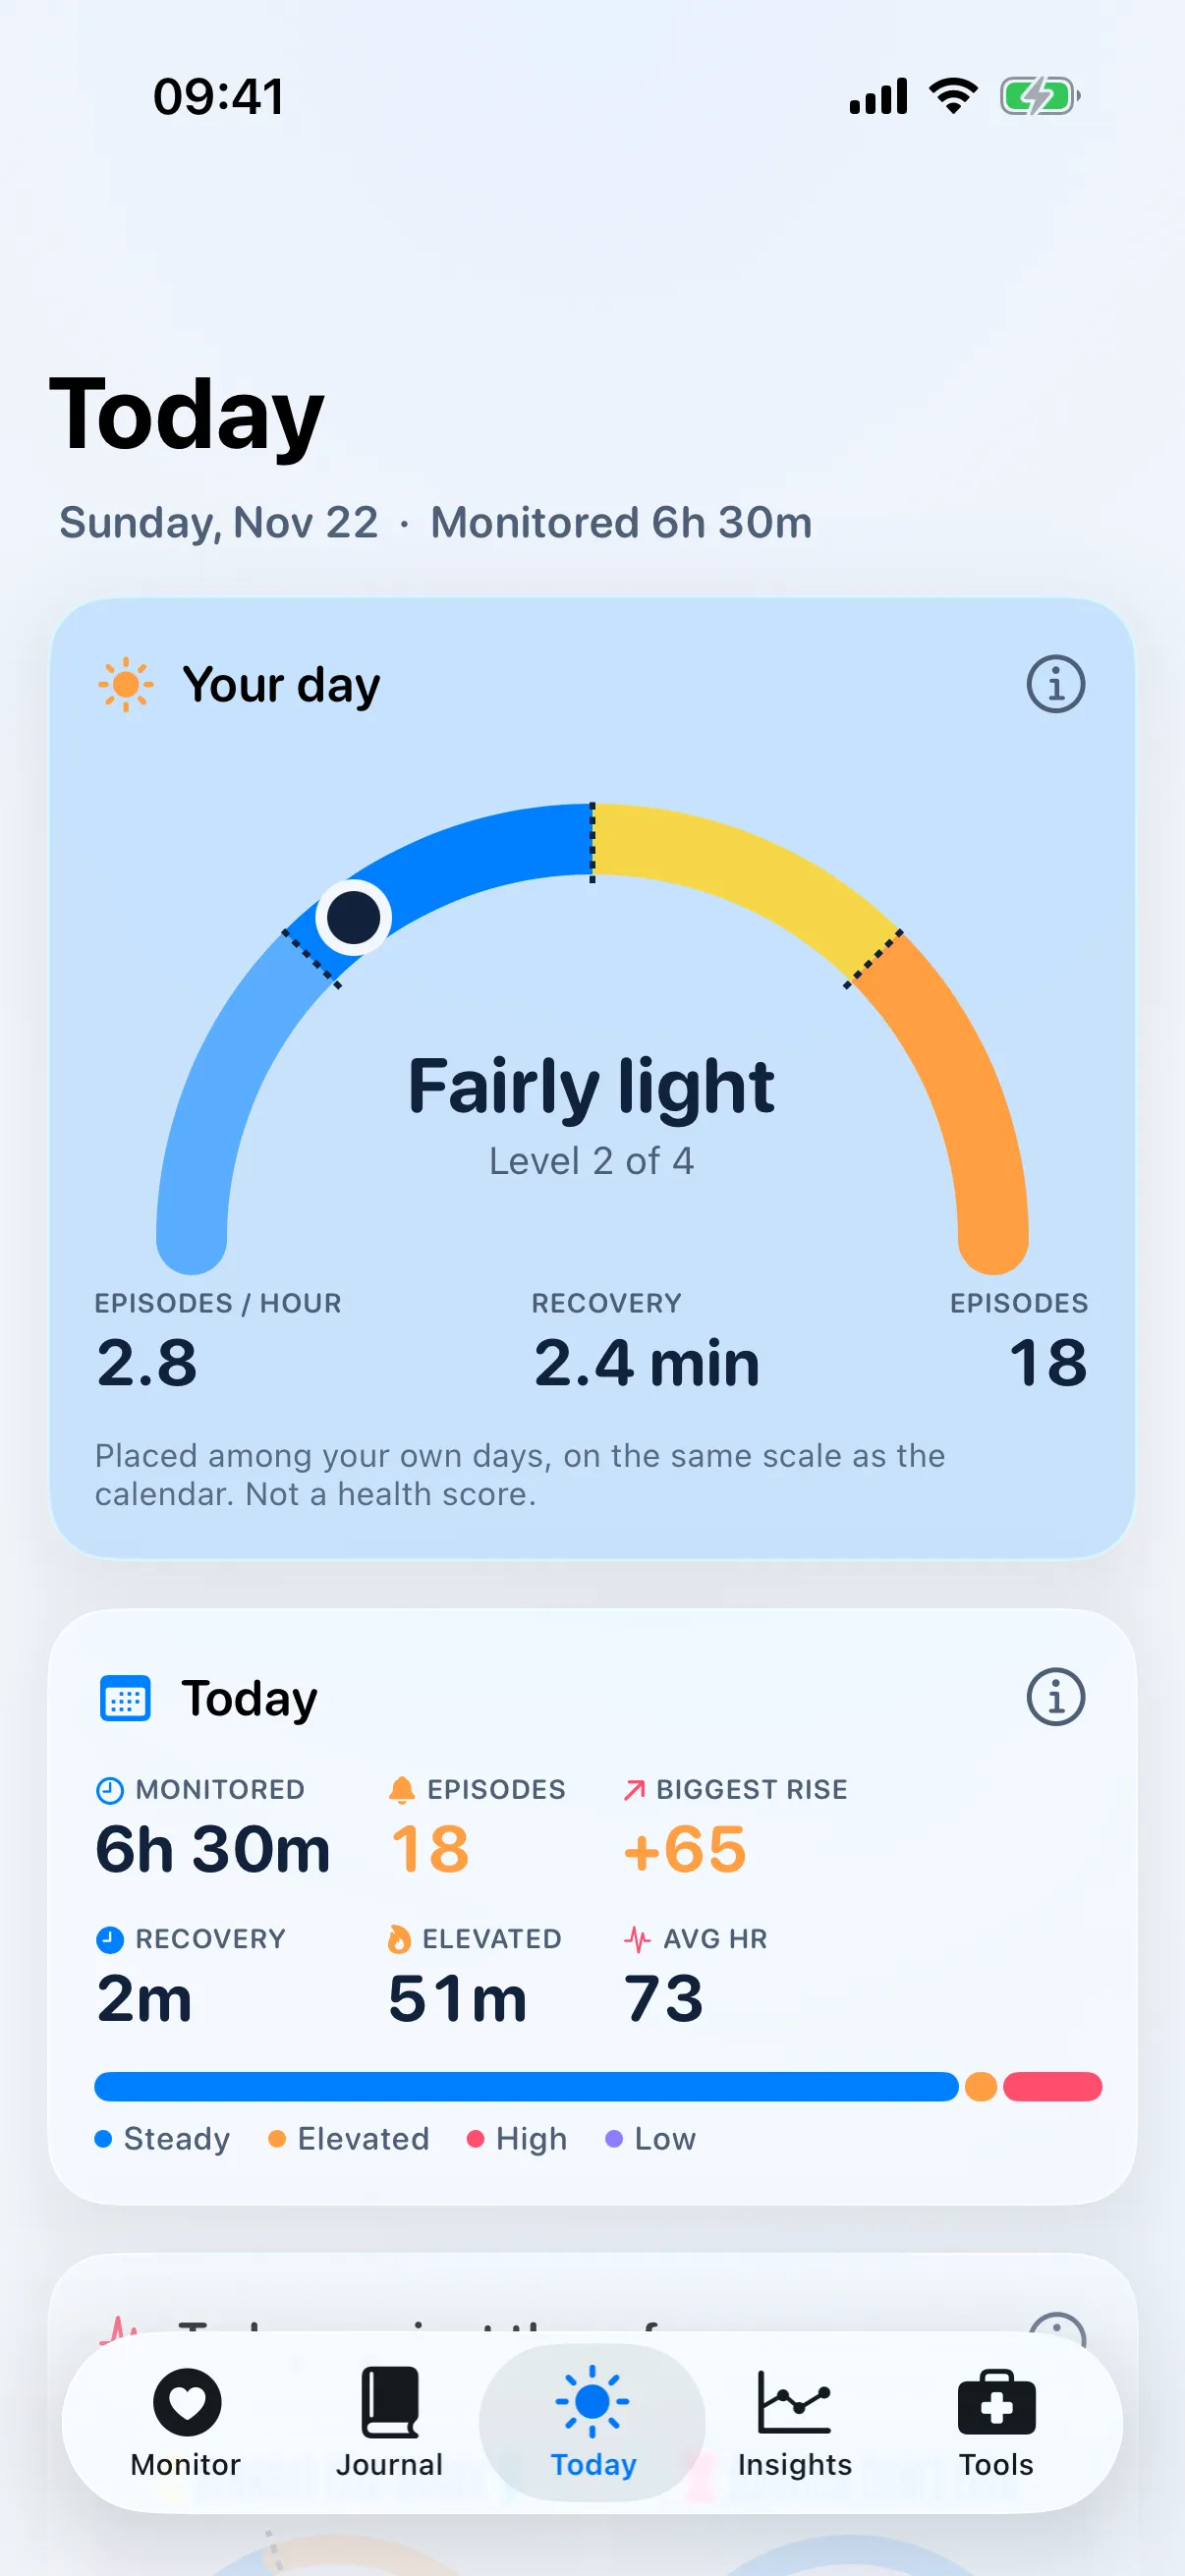
- Your day
- Where today sits on your own scale, from lighter to heavier. Not a health score, and never a comparison with anyone else.
- Today summary
- Time monitored, episodes, biggest rise, recovery, time elevated and average heart rate.
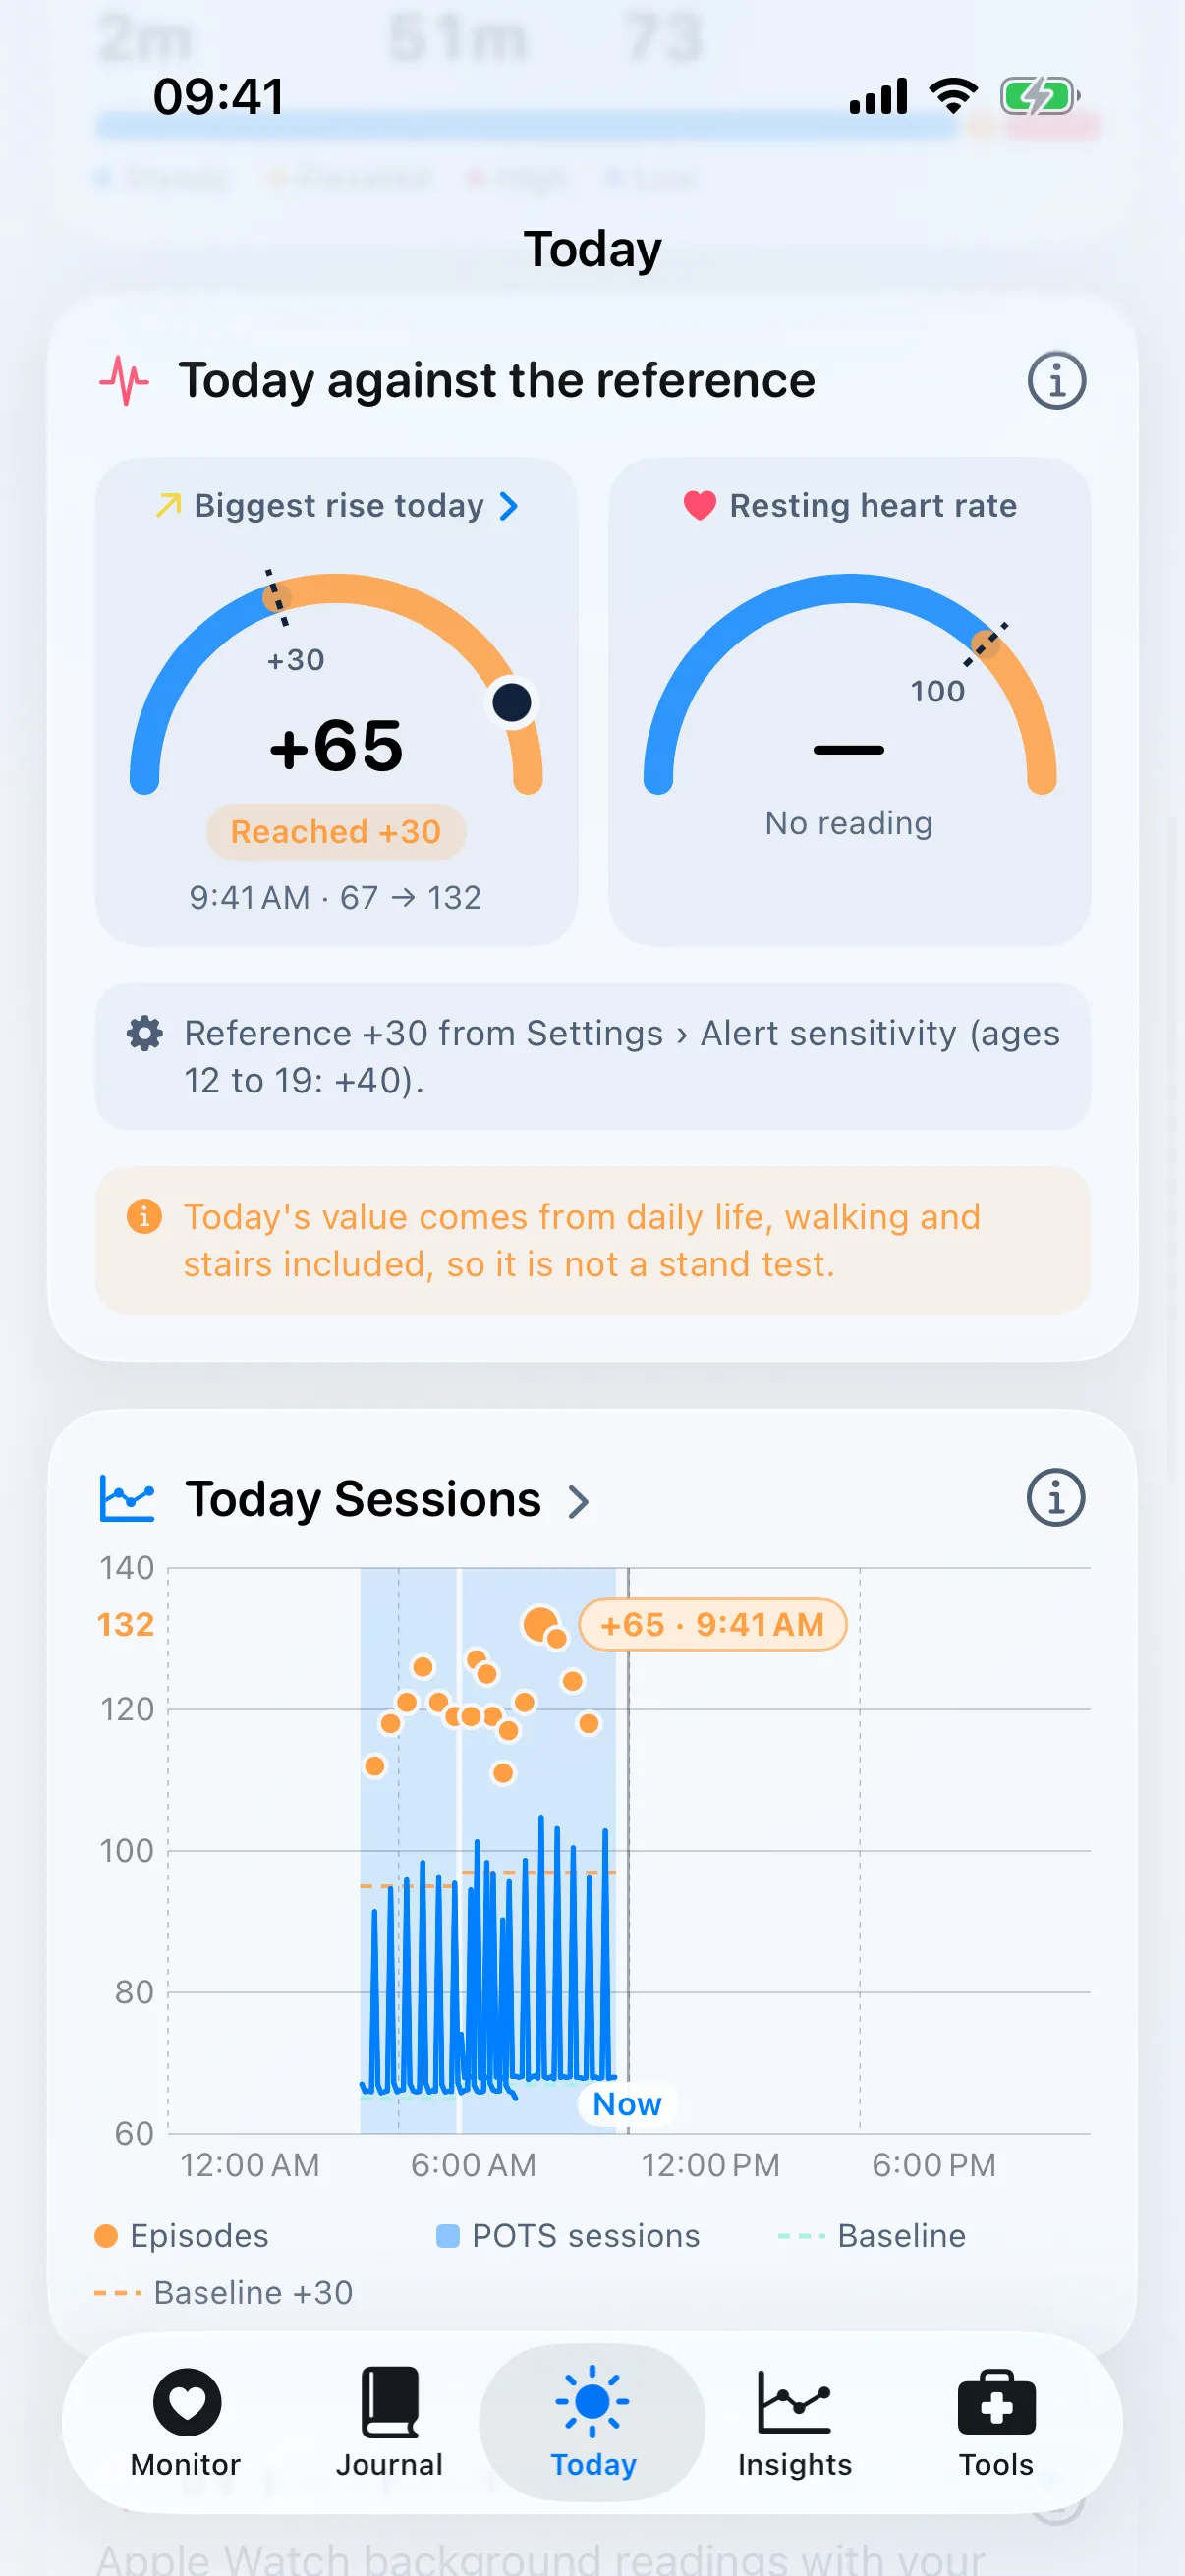
- Today Sessions
- Every reading from midnight to now on one 24-hour chart, with sleep, episodes and your baseline.
- The night before
- Sleep, sleeping heart rate, overnight RMSSD, breathing rate and wrist temperature against your usual range.
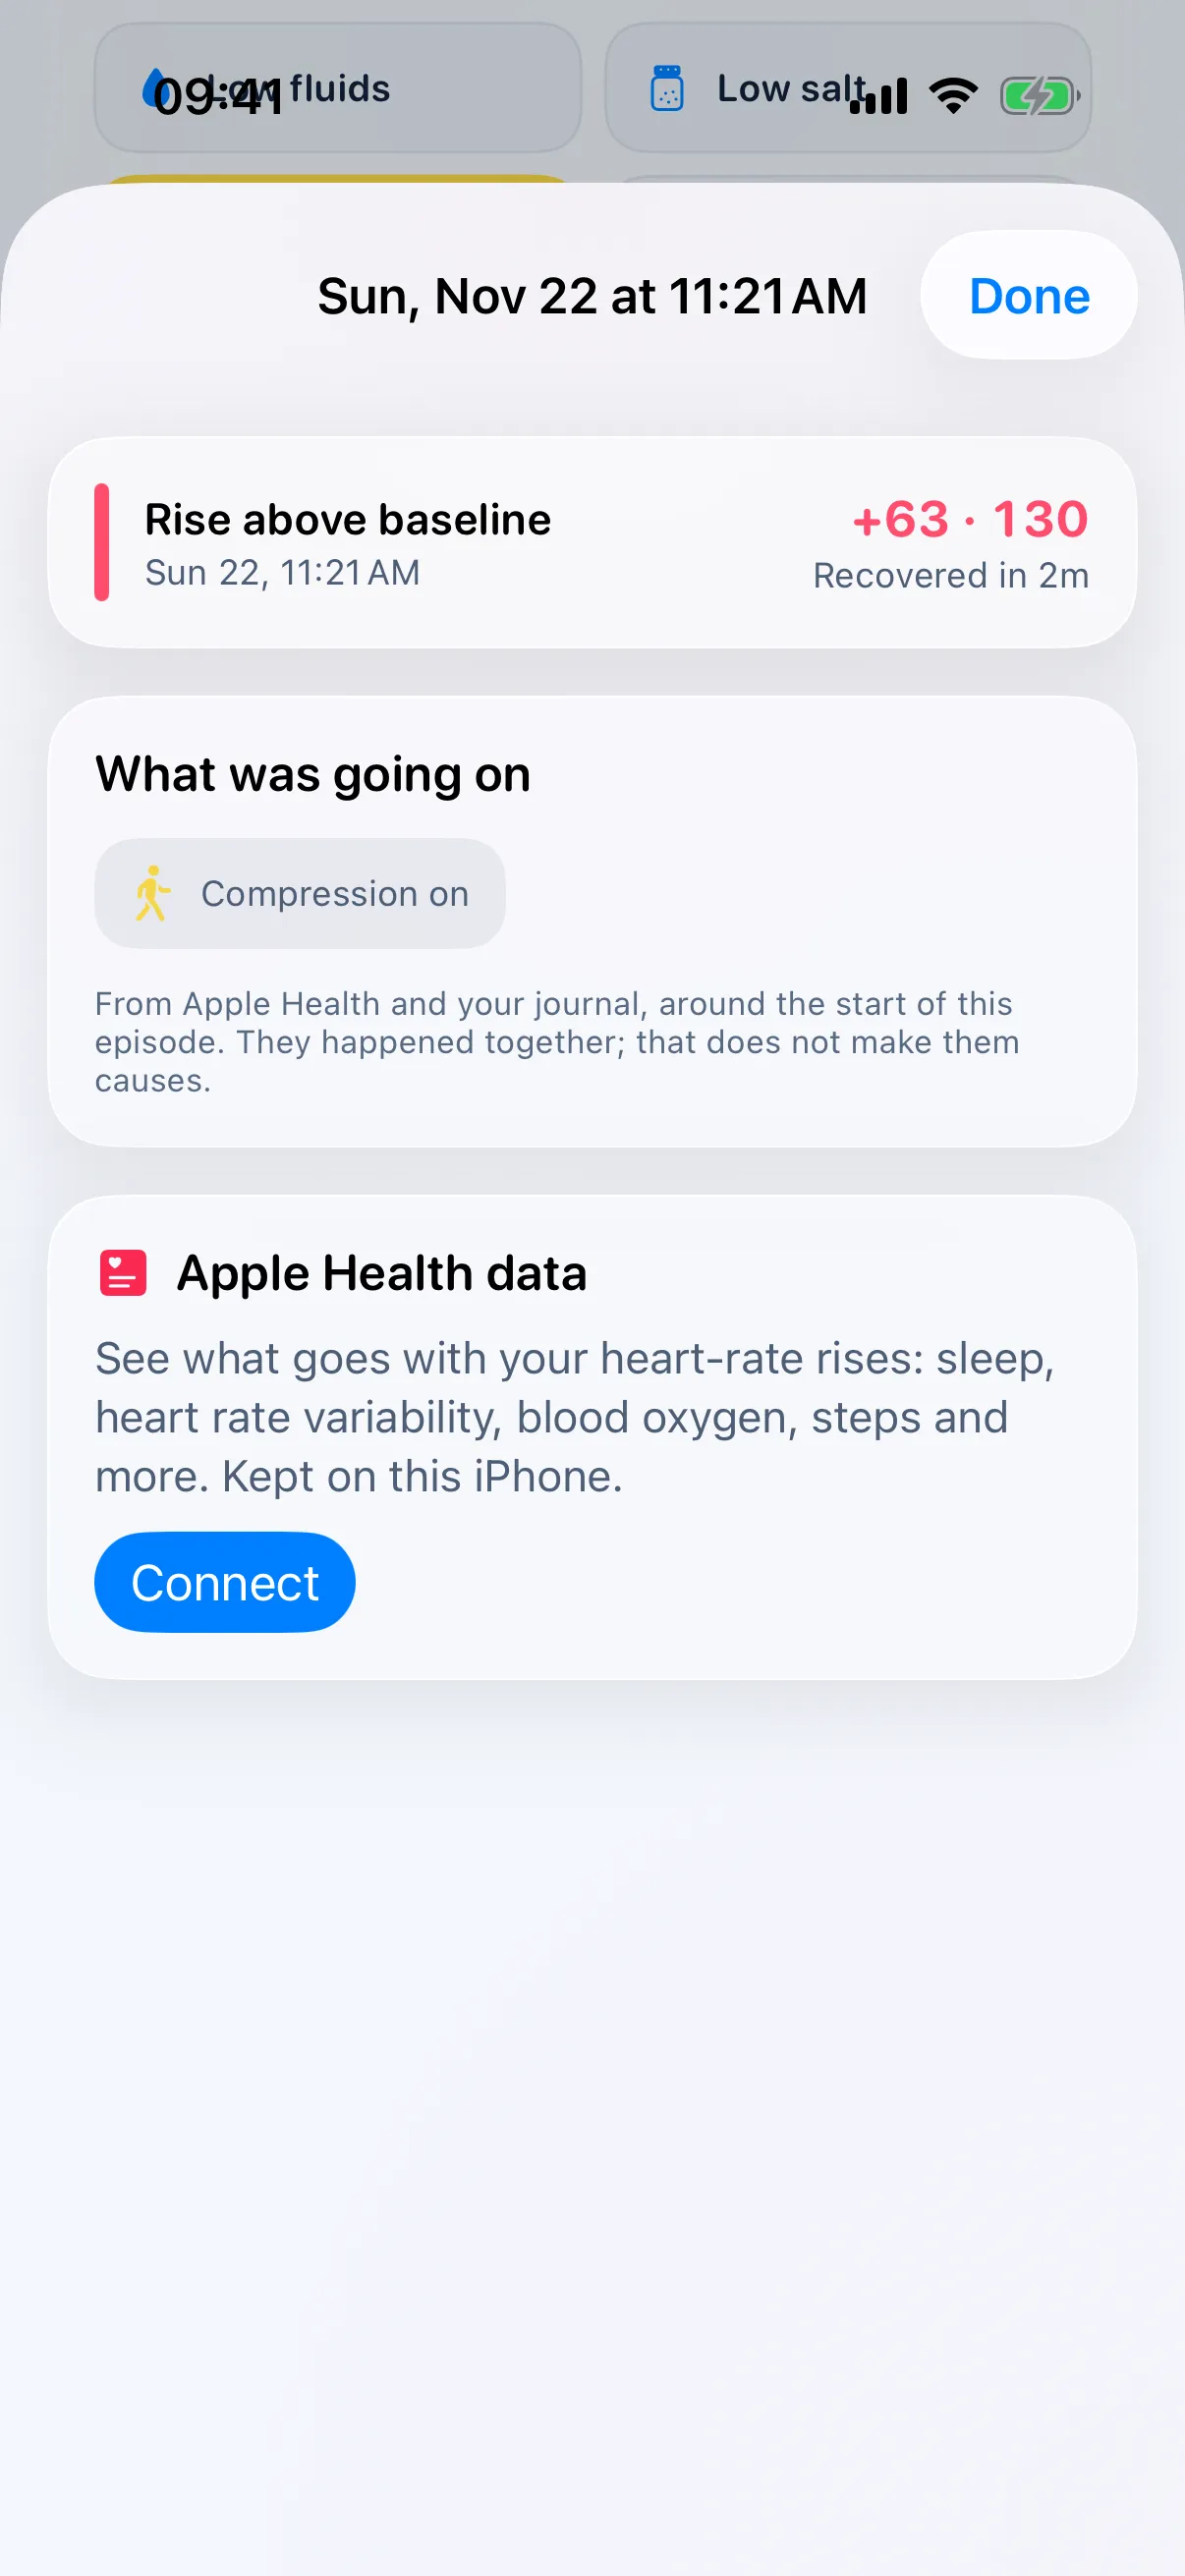
- Look closer at a rise
- Tap an episode to see sleep, time awake, HRV, resting heart rate, steps, workouts, fluids, salt, long standing, blood oxygen and blood pressure around it.
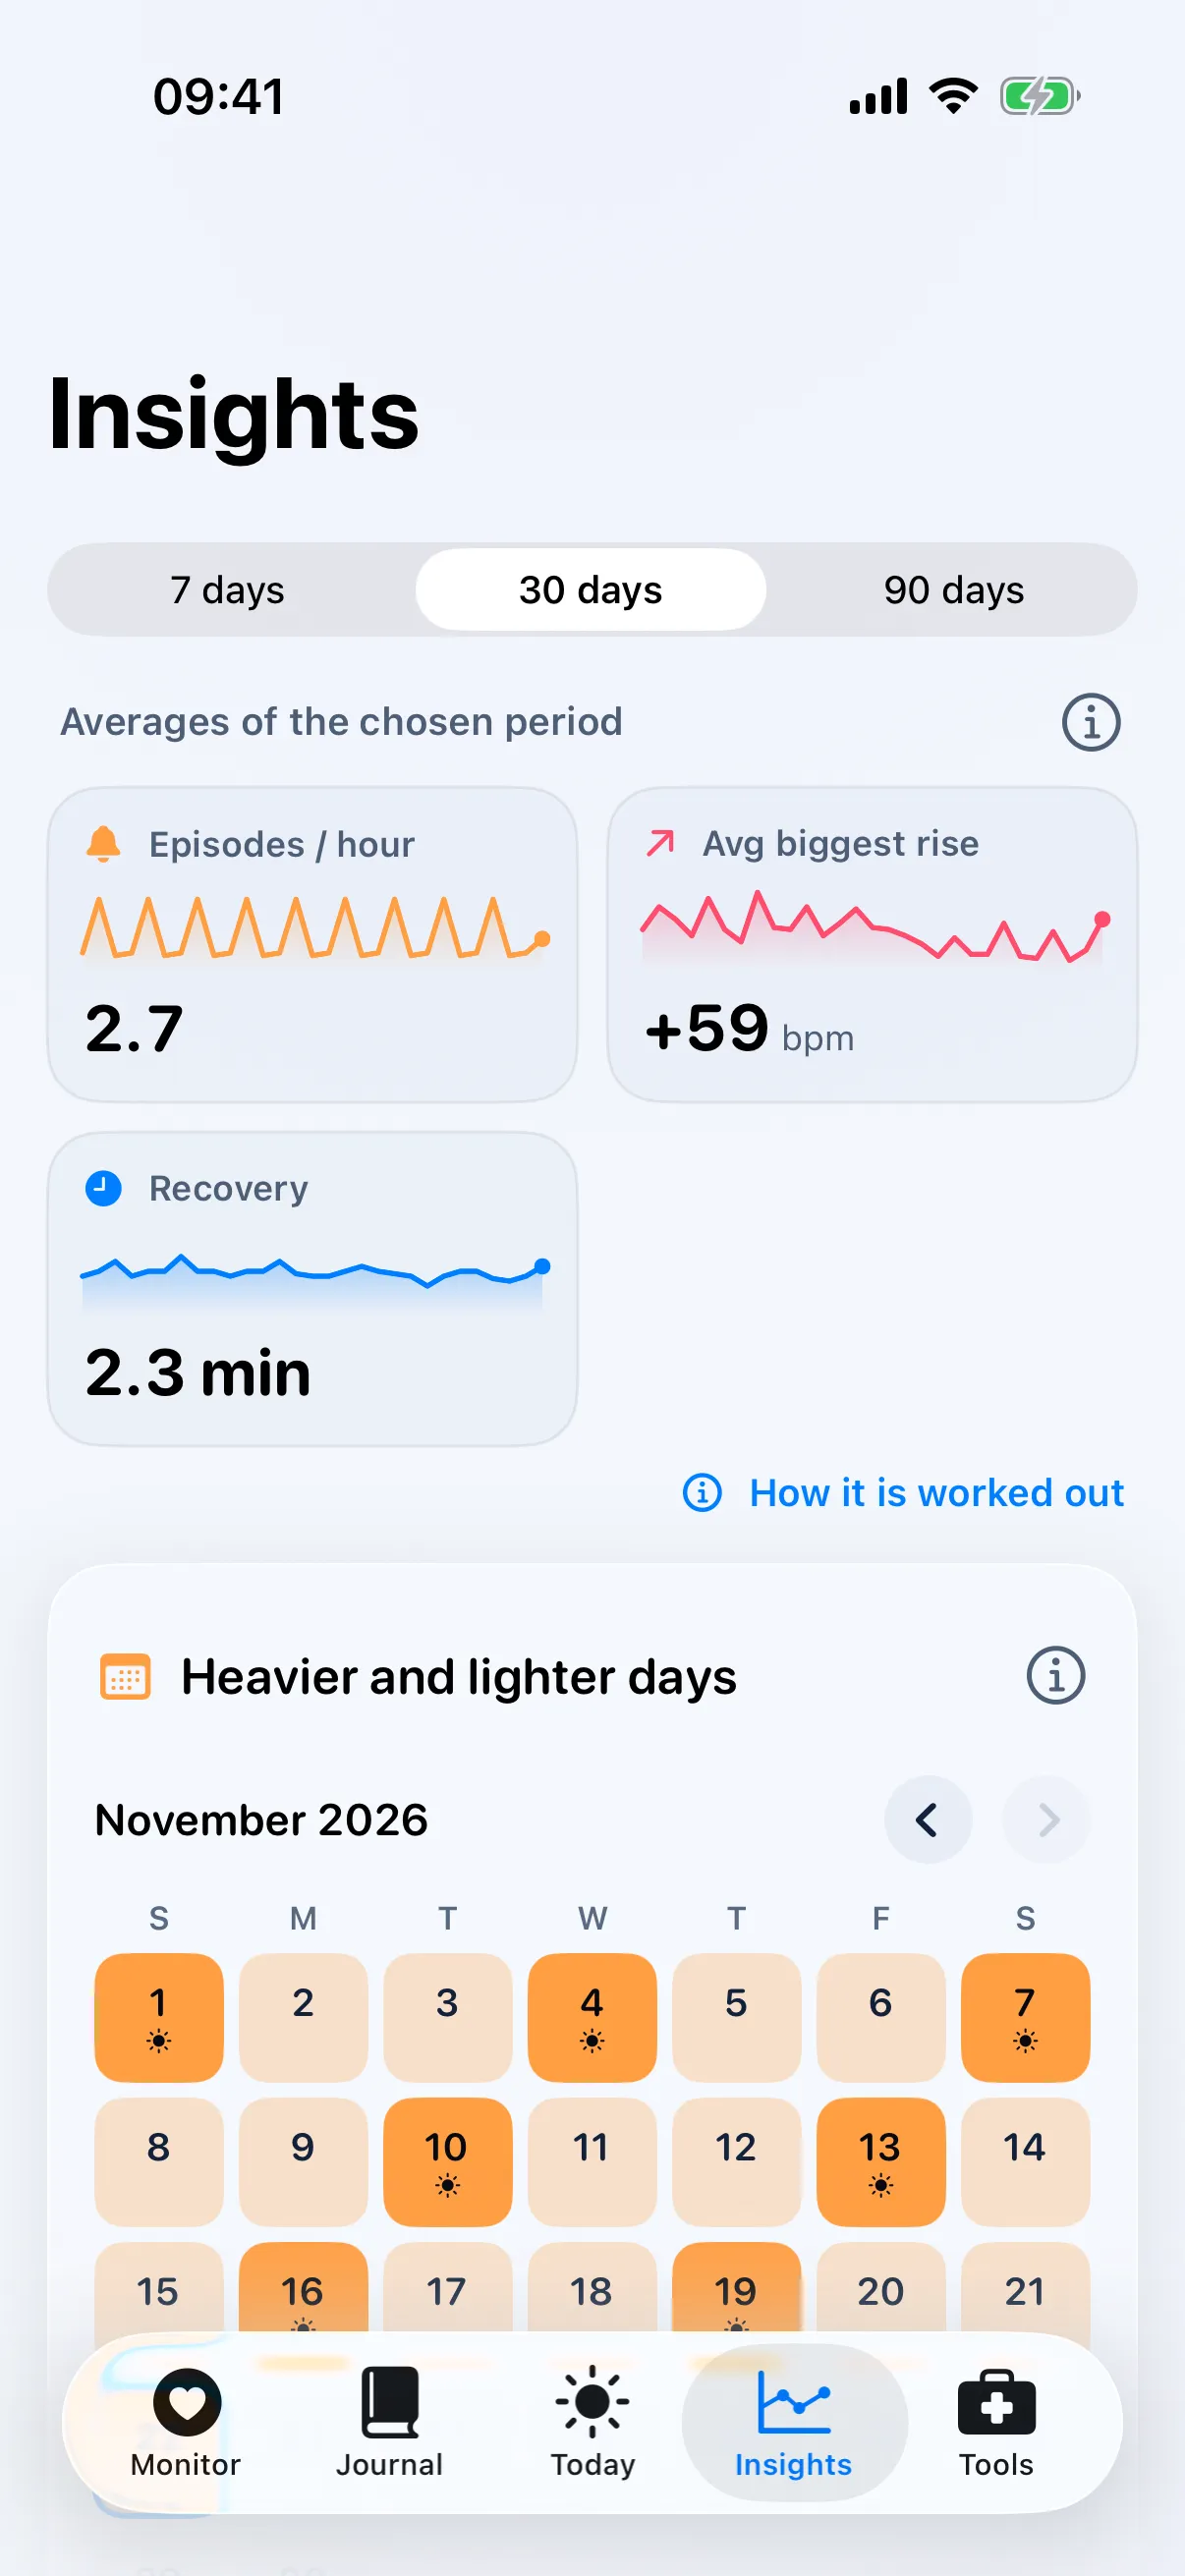
- Insights over 7, 30 or 90 days
- Episodes per hour, average biggest rise, recovery, overnight HRV, heavier and lighter days, stand test trend and before-and-after comparisons.
Things that happen together do not necessarily cause each other. POTS shows timing; your clinician helps interpret it.
Free and Premium. Free shows previews with example data (The night before uses your own data). Premium shows your own data everywhere. Pricing
Bring the whole story to your next appointment.
Free to download. Premium from $2.99 a month, with a 7-day free trial for eligible new subscribers.